Output and Visualization
After the prover completes and the ordering pass produces a parallel plan,
the next step is to present the result to the user. This happens
before any building — even a --pretend run produces the full plan
output. portage-ng offers several output formats: a colour-coded
terminal plan, .merge files for regression testing, interactive SVG
dependency graphs, Gantt charts, and structured reports.
Terminal plan display
The most common output is the terminal plan, which resembles
emerge -vp but adds parallel wave information and richer detail.
The printer (Source/Pipeline/printer.pl) orchestrates the display,
delegating to submodules under Source/Pipeline/Printer/.
Merge list
The plan is rendered as a merge list. Each line represents one action, printed as a numbered step with a coloured action bubble and the full package atom.
A typical plan fragment looks like this:
 └─step 01─┤ install  portage://dev-libs/expat-2.6.4
             │ install  portage://dev-libs/libxml2-2.13.5

 └─step 02─┤ install  portage://dev-lang/python-3.12.3
             │ run      portage://dev-lang/python-3.12.3
             │ confirm  portage://dev-lang/python-3.12.3

 └─step 03─┤ update   portage://sys-apps/portage-3.0.77-r3
             │          (replaces portage-3.0.65)
             │ download https://.../portage-3.0.77-r3.tar.xz

 └─step 04─┤ verify   dev-python/tree-sitter
             │          (non-existent, assumed installed)
Actions within the same step can run concurrently — the step number is the wave. Each line shows:
- Step number — which parallel wave this action belongs to.
- Action bubble — a full word indicating the operation:
install— new installupdate— version upgrade (shows the replaced version)downgrade— version downgrade (shows the replaced version)reinstall— reinstall of the same versionrun— runtime dependency checkconfirm— verify that a running dependency is availabledownload— fetch source from a mirrorverify— assumed dependency that needs manual verification
- Package atom — repository, category, name, and version (e.g.
portage://dev-libs/openssl-3.1.4). - Annotations — contextual notes such as
(replaces ...)for upgrades/downgrades,(~amd64)for keyword-accepted packages,(USE modified)for USE flag changes, or(non-existent, assumed installed)for unresolvable dependencies.
--fetchonly / -F does not introduce a separate plan action. It proves
the same :run plan as --merge and hides merge-phase bubbles
(install / run / update / …), leaving downloads and configuration
pre-actions. See Chapter 15.
Target packages — the ones you explicitly asked to prove — appear in bold green with a green action bubble. Non-target dependencies use cyan text. Assumed or unresolvable dependencies use yellow or red bubbles to draw attention.
Printing styles
portage-ng supports three printing styles, selectable via
config:printing_style/1 (default: fancy):
fancy(default) — the bubble style: a compact visual layout where each action line includes colour-coded indicators and right-edge annotations.column— a tabular layout that aligns version, slot, USE, and repository information in fixed columns for easy scanning.short— a minimal one-line-per-action format.
Powerline bubbles (MesloLGS NF)
In fancy mode, action labels are drawn as Powerline bubbles: a
coloured pill with rounded caps (U+E0B6 / U+E0B4). Those code
points live in the Private Use Area, so a stock monospace font such as
Menlo or SF Mono shows them as tofu boxes or blank glyphs. Install a
Nerd Font that includes the Powerline set — recommended:
MesloLGS NF (Meslo LG S) —
then select MesloLGS NF as the profile font in Terminal.app
(Settings → Profiles → Text → Font). Open a new window afterwards.
On the Linux console (TERM=linux), portage-ng falls back to
angle-bracket labels (<install>) via config:powerline_bubbles/0;
no special font is required there.
Pre-action steps
Before the merge list, the printer can show pre-action steps —
configuration changes that the plan assumes have been applied. These
correspond to the suggestion tags from the prover (see
Chapter 9):
- Accept keyword — packages that need
~archkeyword acceptance. - Unmask — packages that need unmasking.
- USE changes — flag changes needed in
package.use.
Each pre-action step shows the exact line you would add to the
corresponding /etc/portage/package.* file.
Summary line
At the bottom, a summary line shows the total number of actions (new installs, upgrades, reinstalls, etc.), the step count, and the predicted download sizes (to be downloaded vs. already downloaded).
Assumption and warning output
After the merge list, the printer shows any assumptions the prover had to make. These are grouped into two categories:
Domain assumptions are situations where the prover could not find a real solution and had to accept a literal on faith. Each assumption is printed with:
- The package or dependency that could not be satisfied.
- A classification label (e.g. "non-existent dependency", "REQUIRED_USE violation", "model unavailable").
- An actionable suggestion showing how to resolve the issue.
Cycle breaks are points where the prover broke a dependency cycle. Each cycle break shows the cycle path (which packages form the loop) and an explanation of why the cycle was broken rather than treated as benign.
The assumption type classification is handled by
Printer/Plan/assumption.pl, and the detailed rendering by
Printer/Plan/warning.pl. For a full description of the assumption
taxonomy, see Chapter 9.
Writing module
The writer (Source/Application/Output/writer.pl) generates .merge
files — one per target package — containing the portage-ng plan
output in a format comparable to emerge -vp output. These files
are stored in the graph directory configured by
config:graph_directory/1 in Source/Config/<host>.pl.
.merge files serve two purposes:
- Regression testing — by comparing
.mergefiles against.emergefiles (the correspondingemerge -vpoutput for the same target), the compare tooling can detect regressions in dependency resolution accuracy. See Chapter 26 for the comparison workflow. - Offline review — the files provide a persistent record of what portage-ng would do for each target, without needing to rerun the resolver.
Dependency graph generation
The grapher (Source/Application/Output/grapher.pl) produces
interactive SVG dependency graphs that let you visually explore the
dependency tree for a target.
The generation process has three stages:
- Edge extraction — the proof is traversed to collect all dependency edges (which package depends on which, and through what action).
- DOT generation — a
.dotfile is written with nodes representing packages and edges representing dependencies. Nodes are colour-coded by action type and annotated with version and slot information. - SVG rendering — the
dotcommand (Graphviz) renders the DOT file into an SVG. For large graphs, platform-specific scripts underSource/Application/System/Scripts/can run multiple renderings in parallel.
Graph generation is triggered by the --graph CLI flag. The
resulting SVGs include interactive navigation (zoom, pan, node
highlighting) via a built-in JavaScript theme (navtheme module).
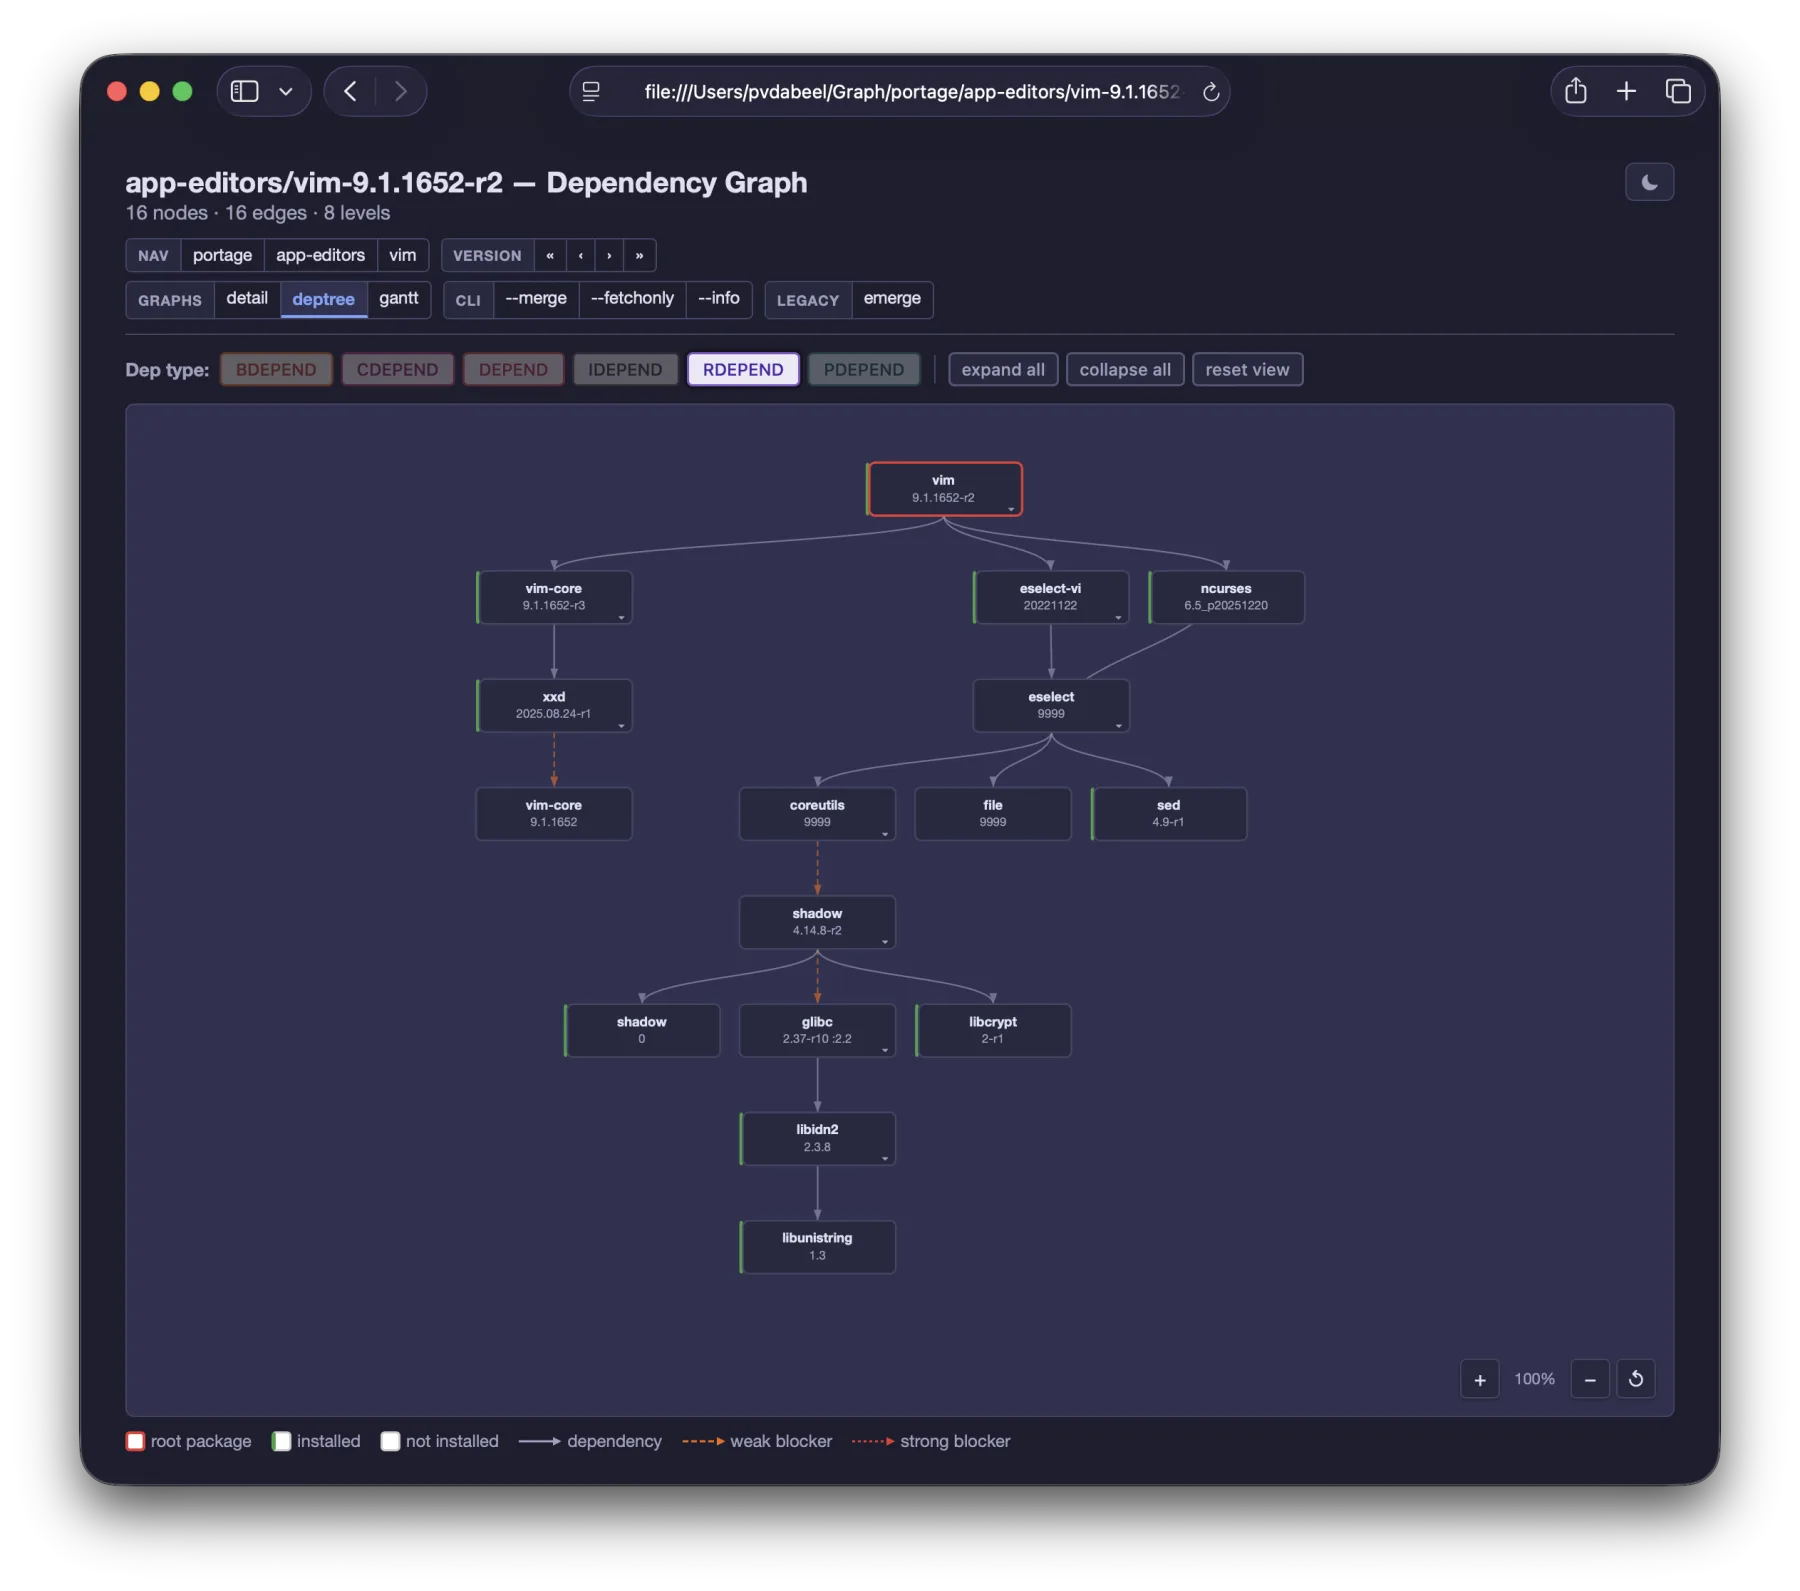
The screenshot below shows a dependency tree for app-editors/vim.
The root package appears at the top with its dependencies fanning out
below. Nodes are colour-coded: the red-bordered root, grey nodes
for already-installed packages, and white nodes for packages that
need to be merged. The toolbar at the top allows filtering by
dependency type (BDEPEND, DEPEND, RDEPEND, etc.) and switching
between graph views.
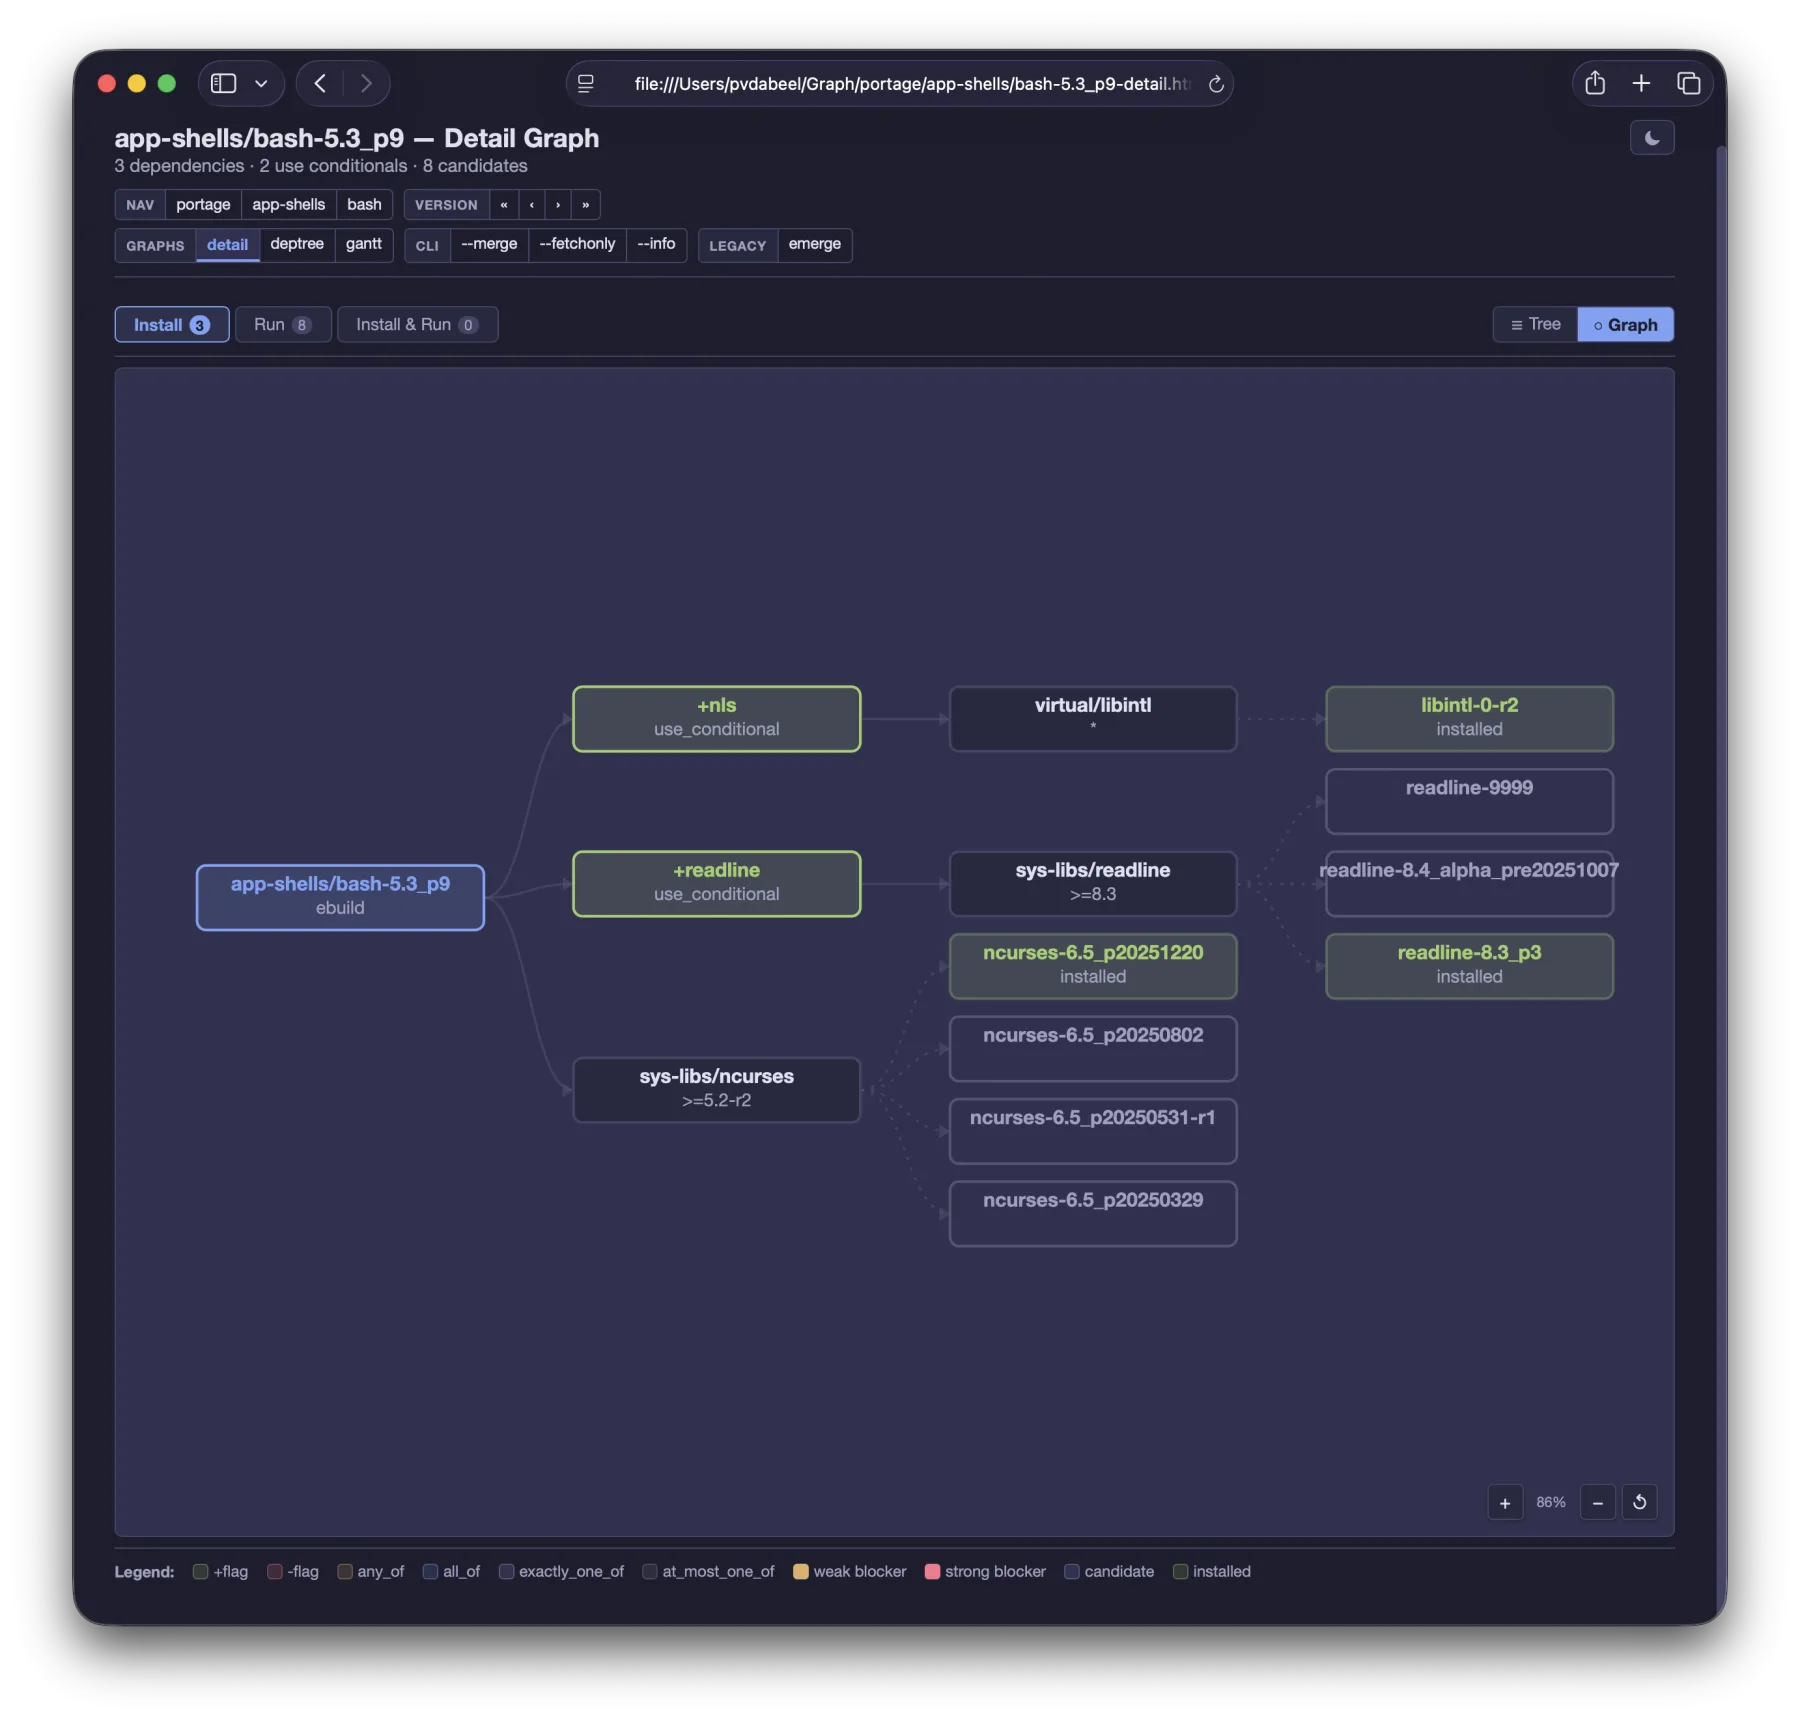
The detail view shows a single package with its full metadata — USE flags (with conditionals), candidate versions, installed status, and dependency atoms. This view is useful for understanding exactly which candidates are available and how USE conditionals affect the dependency tree.
Graph submodules
| Module | Purpose |
|---|---|
dot |
Graphviz DOT file generation with colour and layout |
deptree |
Hierarchical dependency tree visualisation |
detail |
Detailed single-package view with all metadata |
gantt |
Gantt chart rendering (see below) |
terminal |
Terminal-based ASCII graph rendering |
security |
GLSA page: advisories referencing the package, fold-open full text (see Chapter 20) |
tracker |
Bugs page: Bugzilla bugs naming the package from the synced bug store, open bugs and exact-version matches highlighted; facet chips (status, resolution, version, component, severity, keyword, age) and free-text filtering, state kept in the URL hash (see Chapter 19) |
navtheme |
JavaScript navigation theme for interactive SVGs |
Gantt charts
The gantt module produces Gantt charts that visualise the parallel
build schedule computed by the ordering pass. The default view is
wave-accurate: each column is one planning step, and packages in the
same wave sit side by side. Critical path highlights the longest
duration-weighted chain of dependent actions (forward edges only).
Durations come from Knowledge/phase_stats.pl (phase_seconds/3,
exact CPV or the average of other versions of the same C/N).
Downloads use bytes at config:download_mbit/1 (default 100 Mbit/s):
a live git3-src cache, else this CPV's Manifest, else the average
Manifest size of other same-C/N versions (so a 9999 ebuild is
sized from release tarballs when the git cache is cold). Actions with
no measurement keep a unit weight so the path degrades to hop count. Time keeps that wave order and sizes each wave by its
longest recorded action — a wave starts only when the previous wave
finishes — so a 20-minute rust compile is a wide band and later
steps sit to its right.
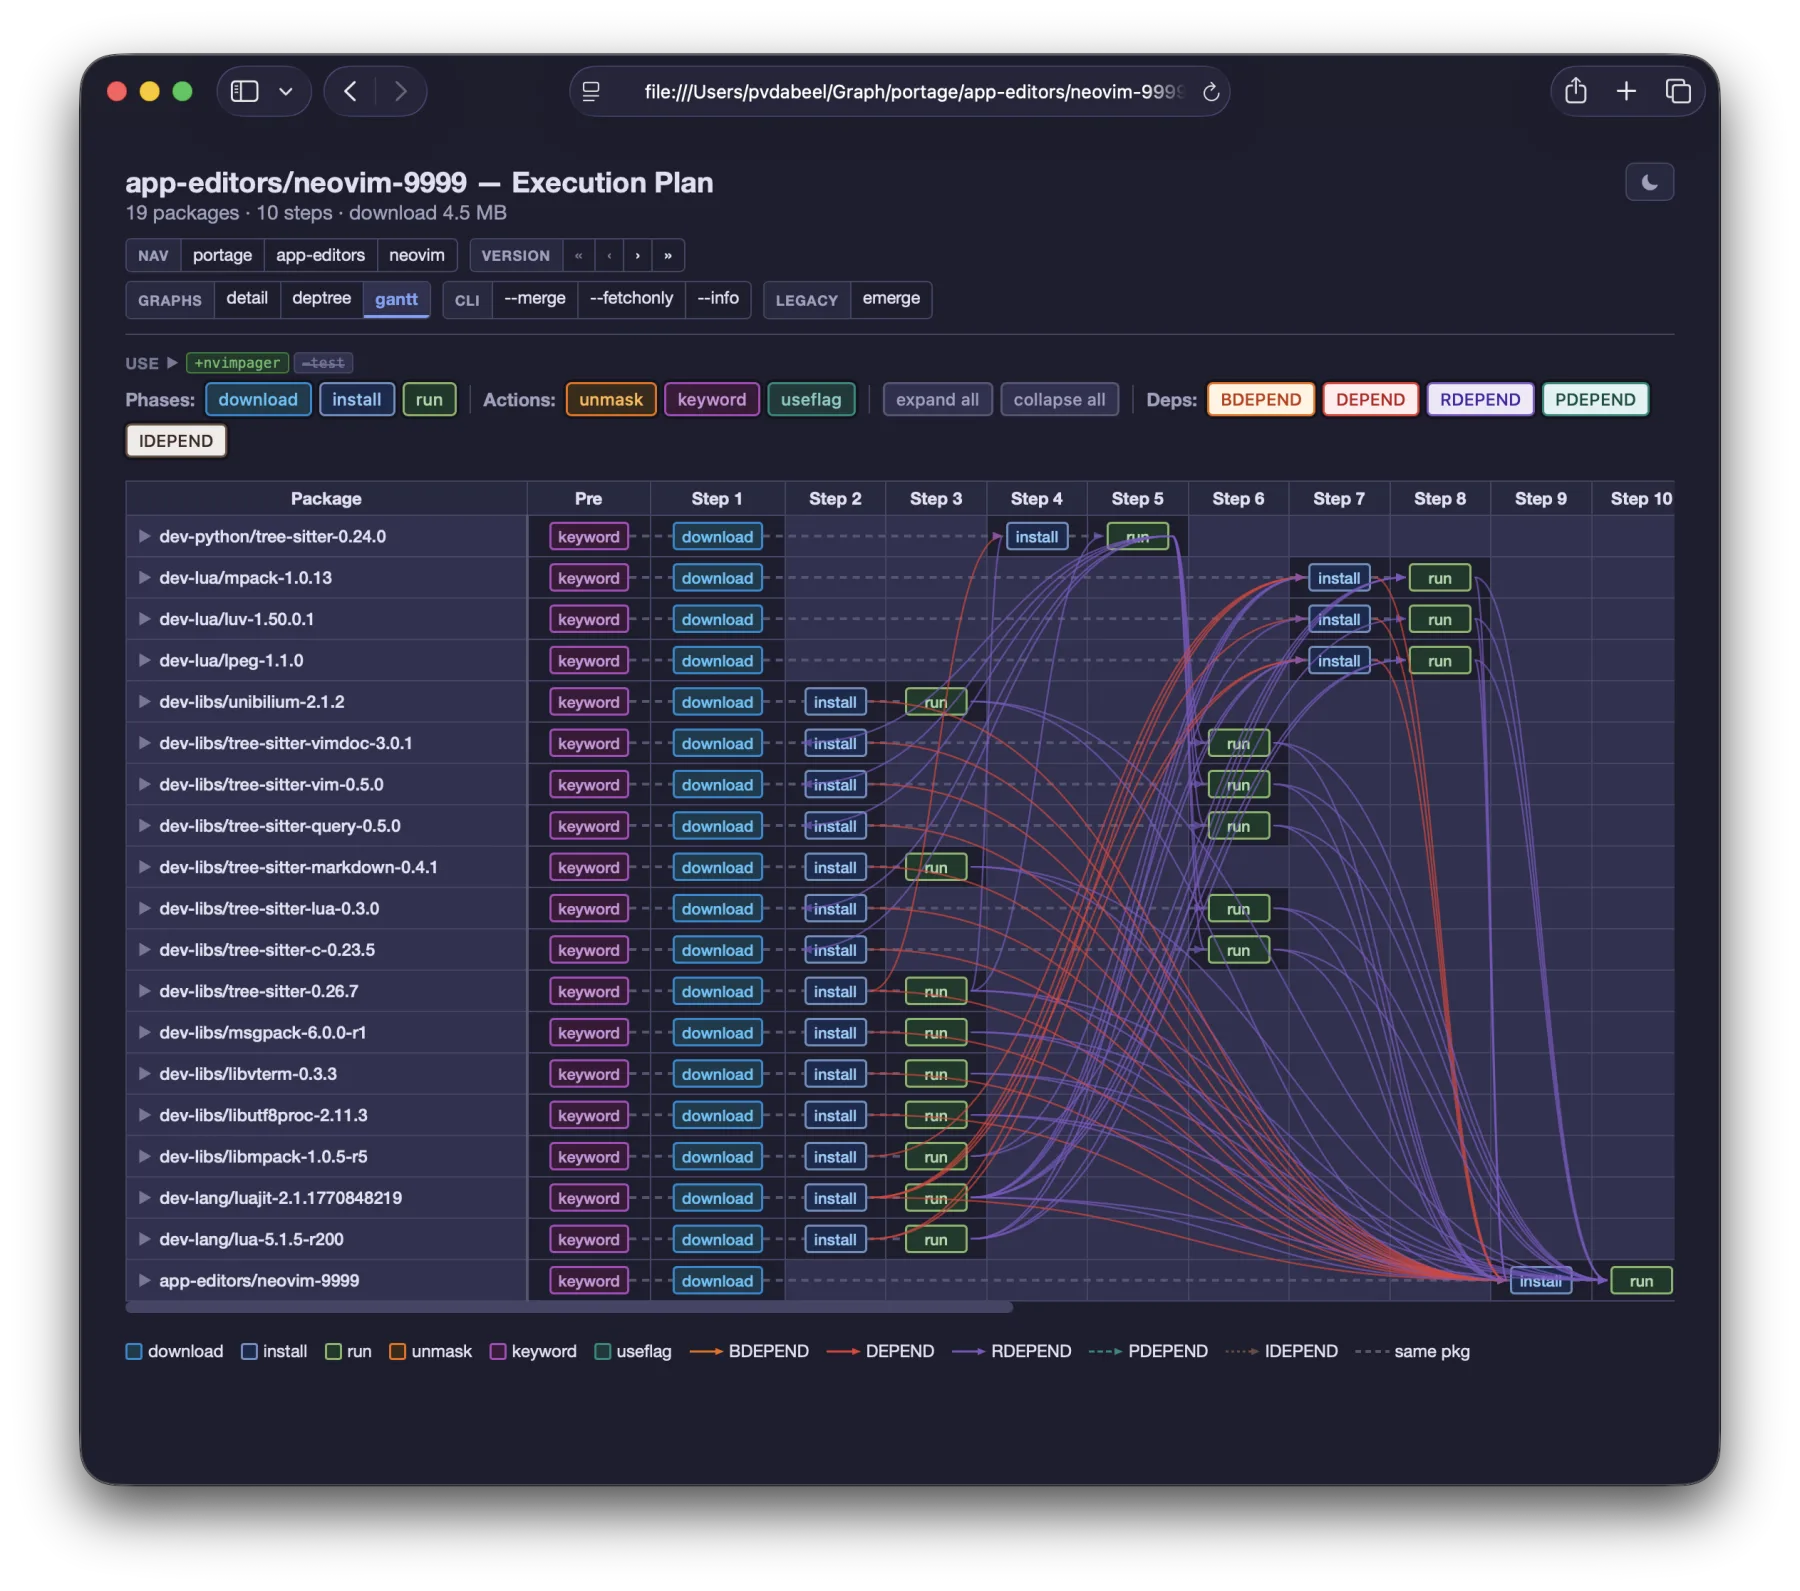
The screenshot below shows the execution plan for
app-editors/neovim. Each row is a package; colour-coded blocks
show download (blue), install (green), and run (light green) phases
across ten steps. Dependency edges are drawn as coloured curves
linking the phases — red for DEPEND, blue for BDEPEND, green for
RDEPEND — making it easy to see which packages gate others and where
parallelism is exploited.
Report generation
The report module (Source/Application/Output/Report/report.pl)
generates structured reports for analysis, typically as JSON files.
Reports can include:
- Plan summaries — total actions, waves, parallelism metrics.
- Assumption breakdowns — counts and details of domain assumptions, cycle breaks, and blocker conflicts.
- Performance statistics — proof time, plan time, cache hit rates, reprove retry counts.
- Comparison data — structured output consumed by the
tinderbox-ng compare
harness (
tinderbox-ng compare/tinderbox-ng analyze), which diffs portage-ng plans against emerge output.
Printer submodules
The printer pipeline is split across focused submodules:
| Module | File | Responsibility |
|---|---|---|
plan |
Printer/Plan/plan.pl |
Plan rendering (waves, actions, USE flags) |
assumption |
Printer/Plan/assumption.pl |
Assumption classification and display |
cycle |
Printer/Plan/cycle.pl |
Cycle explanation rendering |
warning |
Printer/Plan/warning.pl |
Assumption detail and warning blocks |
timing |
Printer/Plan/timing.pl |
Build time display |
index |
Printer/index.pl |
Package index display |
info |
Printer/info.pl |
Package info display |
stats |
Printer/stats.pl |
Statistics display |
state |
Printer/state.pl |
State tracking during printing |
news |
Printer/News/news.pl |
Gentoo news item display |
Further reading
- Chapter 13: Ordering — Plans as Proofs — how waves and parallelism are computed
- Chapter 15: Command-Line Interface —
--graph,--verbose,--quiet, and other output flags - Chapter 16: Building and Execution — how the plan is executed
- Chapter 26: Testing and Regression — how
.mergefiles are used for regression testing